Nationwide, around 5 million children under age 6 live with a parent who works a nontraditional-hours schedule, which we define as any hours outside of 7 am to 6 pm Monday to Friday. However, very little is known about the supply of licensed nontraditional-hours child care. To better understand the supply of nontraditional-hours child care providers, we examined their characteristics and the neighborhoods in which they operate in six states (Illinois, Minnesota, Missouri, Oregon, Washington and Wisconsin). These states participated in our Child Care Data Center (CCDC), a tool which allows users to view data stories on topics such as child care accessibility and affordability.
Characteristics of Nontraditional-hours Child Care Providers
- Around 37% of child care providers in these states offered care during nontraditional hours.
- On average, nontraditional-hours providers offered 16 hours of nontraditional-hours care per week.
- Nontraditional-hours providers were more often open during early morning hours (4:30 am-7 am) than during evening, overnight or weekend hours.
- A higher percentage of family child care homes provided child care during nontraditional hours than centers.
- On average, nontraditional-hours child care providers charged higher prices than traditional-hours providers.
These findings have several implications. First, evening, weekend and overnight care are provided by very few providers compared to the number of providers who offered child care in the early morning. This suggests limited availability of child care for families working evening, night or weekend shifts. Second, the continued decline in the number of family child care homes overall is likely further limiting nontraditional-hours care available to working families. Because the majority of nontraditional-hours care is provided by this provider type, the overall decrease can lead to even more limited choices for parents who need child care during these hours. Finally, nontraditional-hours child care is more expensive than traditional-hours care, further restricting the options of parents working nontraditional-hours schedules.
Nontraditional-Provider Profiles
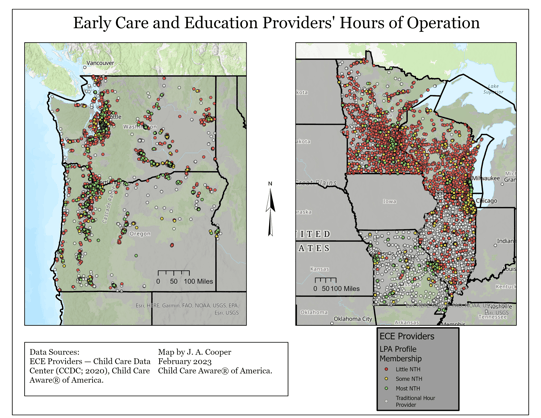
Our team also categorized nontraditional hours providers into three profiles to understand the differences between these providers. Overall, the majority of nontraditional-hours providers fell into the “few nontraditional hours” category, meaning they only offer a few hours per week outside of traditional hours.
- Few Nontraditional Hours: N = 12,056 (84% of sample)
- Some Nontraditional Hours: N = 1,653 (11% of sample)
- Most Nontraditional Hours: N = 657 (5% of sample)
The table below shows the average number of hours per week that nontraditional-hours providers were open by timeframe: early morning (4:30 am-7 am), evening (6 pm-midnight), overnight (midnight to 4:30 am) and weekends (Saturday and Sunday). Providers in the ”few nontraditional hours” category were typically open during early morning hours, but not as much during other nontraditional-hours timeframes (evening, overnight and weekends).

The map below shows the distribution of nontraditional-hours child care among the six states included in this study. Even in states with many nontraditional-hours providers, most of them offered a few hours per week (M = 3 hours) outside of the standard 7 am-6 pm, Monday to Friday schedule.

Please see our resource for more details about these findings, along with infographics.
Neighborhood Characteristics of Nontraditional-Hours Providers
We also examined the characteristics of neighborhoods where nontraditional-hours providers are located. To do this, we used data from the Child Opportunity Index 2.0 (COI 2.0)* and the locations of nontraditional-hours child care providers. Each Census tract (or neighborhood) receives an overall COI score and individual scores ranging from one (low opportunity) to five (high opportunity) in each of three domains: education, social and economic, and health and environment.
When we compared the nontraditional-provider profiles to COI scores, we found that generally:
- Providers who offer few nontraditional hours are in Census tracts with substantially higher COI scores.
- Neighborhoods where there were higher percentages of adults 25 and over with a college degree or higher have more providers that offered few nontraditional hours.
- There were significantly fewer providers that offered few nontraditional hours in neighborhoods that were experiencing higher levels of poverty.
- There were significantly more providers that offered few nontraditional hours in neighborhoods that were experiencing higher levels of employment.
These findings seem to indicate that there is more nontraditional-hours care in neighborhoods with lower COI scores. This may be due to parents with low incomes being more likely to work during nontraditional hours. There may be less demand for child care in neighborhoods with lower levels of poverty and higher COI 2.0 scores.
While more research is needed, especially related to the demand for child care during nontraditional hours, we hope that these findings help advance the conversation about the need for nontraditional-hours child care that works for families who need it.
This project was supported by the Administration for Children and Families (ACF) of the United States (U.S.) Department of Health and Human Services (HHS) as part of a financial assistance award (Grant #: 90YE0230) totaling $100,000 with 100 percent funded by ACF/HHS. The contents are those of the author(s) and do not necessarily represent the official views of, nor an endorsement by, ACF/HHS, or the U.S. Government. For more information, please visit the ACF website, Administrative and National Policy Requirements.
*The COI 2.0 is an index developed by Diversity Data Kids that assigns child opportunity scores by Census tract based in three domains: education, social and economic, and health and environment. The COI 2.0 developers calculated index scores using data from sources such as the U.S. Census Bureau, the Centers for Disease Control (CDC) and the Environmental Protection Agency (EPA).


