
Geographic Information Systems (GIS) are a set of powerful software tools used to create and display maps that help geographically illustrate and communicate complex problems. They can also highlight potential solutions — maps can help identify assets and resources, as well as understand underlying location-based trends in datasets. This wealth of information can be key for child care advocates to educate and inform local and state decision-makers about the challenges facing the child care community and the need to advance specific policy solutions.
To help tell the story of their unique child care landscapes, Child Care Aware® of America (CCAoA) partnered with state child care leaders to use GIS to examine the supply of and access to child care programs, emergency preparedness and response, participation in the Child and Adult Care Food Programs (CACFP), and socioeconomic demographics of populations of children and parents. These stories are shared via a variety of interactive mediums such as customized state dashboards and narrative story maps, all of which can be useful and meaningful tools to inform policy and advocacy conversations.
This blog explores two map dashboards we created with state early childhood education partners in West Virginia and Nebraska in 2023. The map dashboards were developed with the generous support of the Alliance for Early Success.
West Virginia’s Mapping the Gap™ Dashboard
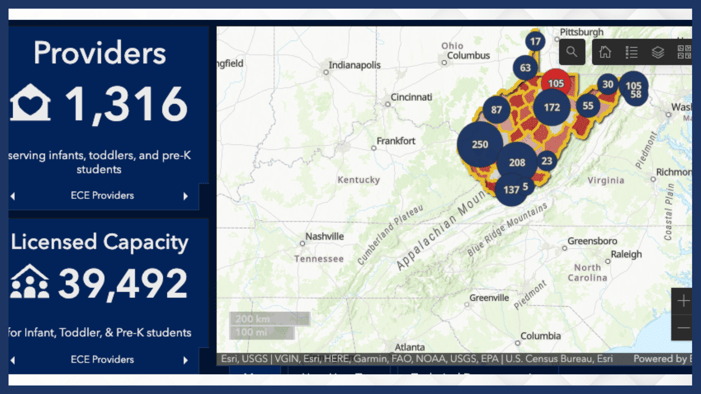
CCAoA developed a map dashboard to show the supply and demand of child care for children in West Virginia and explore if any gaps in child care access existed across the state. This project was created in collaboration with TEAM for West Virginia Children and the West Virginia Association for Young Children.
The current data dashboard includes all 1,412 open and licensed child care providers throughout West Virginia as of November 2023, which have a total licensed capacity to serve 45,235 children up to age 12. Of the total providers, 1,316 (or 93% of the total) are center-based, family child care, or Head Start and have the capacity to serve 39,492 infant, toddler, and pre-kindergarten slots. Data from West Virginia’s Mapping the Gap™ analysis shows that potentially 25,828 (41%) of children under age six who may need child care do not have access to child care throughout the state.
Using the Dashboard
The map contains multiple elements for users to interact with. The tool includes information about individual programs, including the type of care, operating hours and licensed capacity. Users can filter the supply, demand, and gap statistics by county, state legislative district, or by type of child care setting. The dashboard also includes widgets that show summary statistics, including licensed capacity, the met and unmet potential demand for child care, the number of open child care providers by type of care, and the statewide share of infants, toddlers and pre-k students without child care access from February through October 2023. Full instructions on how to use this dashboard and the methodology that supports it can be found in tabs in the dashboard itself.
Developing the Dashboard
To explore the relationship between supply and demand, it is imperative to have reliable data sources with counts of the number of children in need of care (demand) and the number of available child care spots (supply). True demand for child care can be difficult to quantify because it depends on a full range of family situations, such as parent or guardians’ employment status and schedule, cost of care, services provided, and quality of care. There is no single source that quantifies this complex metric, so early childhood education researchers rely on proxies to approximate the number of children in need of (i.e., are “demanding”) child care. To approximate demand, CCAoA uses the industry standard: the US Census American Community Survey Table B23008. This table contains data on children under 18 by their parent’s employment status. The assumption is that if all household parents are employed, they are otherwise occupied with those duties and cannot provide care for their children themselves and therefore, their children need care.
We used the latest potential demand figures at the time of initial analysis: the 2021 ACS 5-year estimates. CCAoA collected this data at the block group unit of analysis, the most geographically precise level at which the census offers this data. We sourced the block groups’ geographies from the US Census TIGER line files and joined the relevant demographic data to their geographies. Future updates to this tool will continue to source from the most recent ACS potential demand data.
To approximate supply, CCAoA worked with the West Virginia Association for Young Children to connect with the West Virginia Department of Health and Human Resources’ Division of Early Care & Education unit to obtain data on licensed providers that are currently open. This data included provider type of care, licensed capacity, and address. All open providers are displayed in the dashboard. However, the Mapping the Gap™ analysis only uses providers listed as types of child care centers, family child care providers, or Head Start Programs. School-age programs, while critically important for serving older children, were not included to match the age parameters of our demand data. Summer programs do not provide consistent, year-long care so they were not included in a standard supply metric. While we recognize that licensed capacity does not always accurately reflect the number of children enrolled at any time in programs, we use this as a proxy for a more accurate measure such as desired capacity.
The map dashboard is updated periodically when new data becomes available from the state to provide users, including state policymakers, with the most up-to-date statistics.
Nebraska’s Child Care and Public Transit Dashboard
In collaboration with First Five Nebraska, CCAoA created a map dashboard that explores the child care and public transit landscape in metropolitan Nebraska (specifically, the Lincoln and Greater Omaha areas). This first-of-its-kind interactive resource intends to give local and state decision-makers insight into the challenges and opportunities involved in coordinating two major aspects of metropolitan infrastructure by showing the geographic relationship between child care facilities and public transportation stops. Specifically, this tool measures the walking time and distance between child care programs and public transit stops to evaluate how accessible child care is by public transit. According to the dashboard, only about 45.5% of all licensed child care providers serving children under age 6 are located within a 10-minute walk of a public transit stop in the Lincoln and Greater Omaha metro areas.
Using the Dashboard
Users can map the proximity of child care programs to Lincoln and Omaha’s public transit routes. Pop-up windows provide detailed information about individual child care programs, including program type, Step Up to Quality rating, and whether subsidy is accepted. The dashboard contains filters to identify child care providers based on program characteristics as well as distance (up to 20 miles) and walking time (up to 599 minutes) from the nearest public transit stop. Users can also toggle layers to reveal child care providers, transit lines and data related to children under age six. The dashboard’s widgets can further be filtered by child care provider types of care and Step Up to Quality rating.
The map also allows users to toggle layers like children under six with all parents in the labor force and children under six living below 185% federal poverty level (FPL), the threshold for families to qualify for subsidy eligibility in Nebraska through October 2026. Research shows that individuals with lower incomes are more likely to use public transportation in the US, which is pertinent for policymakers to consider in conversations around equitable access to child care.
Developing the Dashboard
First Five Nebraska first merged two sources of provider-level data from the Licensing Agency of the Nebraska Department of Health and Human Services via the Child Care Referral Network and the Nebraska Step Up to Quality website. Providers are classified by types of child care (centers, family child care homes, early Head Start and Head Start, Preschool, and school-age-only centers). First Five Nebraska also helped obtain the Lincoln bus routes and stops from StarTran, while Omaha's bus routes and stops were obtained from the ArcGIS Online public library. The final dataset included 19 public transit routes in Lincoln and 27 routes in Omaha, including the proposed Omaha streetcar.
To determine walking time and distance from transit stops to child care, CCAoA used a mapping analysis method, Network Analysis, which models transportation or utility networks, such as roads, railways, or water distribution systems. It helps optimize routes, calculate travel distances, and solve other complex network-related problems. For our network, we used streets and paths from OpenStreetMap and retained only those walking paths that were age-appropriate for children’s use such as sidewalks on small roads or walking trails, while excluding routes like large highways and tunnels. The model calculated the shortest distance between each child care provider to its closest transit stop, with a walking time speed of 2 miles per hour, which we determined with First Five Nebraska is a reasonable walking speed for young children with adult supervision.
We included two additional census data points in the map dashboard to further highlight the child care landscape in metropolitan Nebraska, especially around the communities that would benefit from more equitable access to care. These two data sources include children under six with all parents in the labor force (B23008) as a proxy for child care demand and children under six living below 185% FPL (B17024).
Advocating with Map Dashboards
Data is an essential part of advocacy. Our efforts to advocate for additional child care investments are strengthened when we can share substantiated data analyses that help make the case for policy change. Map dashboards can be incredibly useful tools to help visualize current challenges and opportunities in a state’s early care and education systems in an interactive way. Map dashboards, like the ones created for West Virginia and Nebraska, can provide a basis for city and state leaders to make well-informed and strategic decisions that will increase access to licensed child care.
The West Virginia map dashboard was designed to share information with state legislators on the potential child care supply gaps so they can better understand the access challenges families face within their legislative districts. Advocates released the dashboard in February 2023 as part of West Virginia’s first state legislative Child Care Day. The West Virginia advocates walked state legislators through the map dashboard and highlighted the findings on a popular statewide radio talk show among policymakers. The map dashboard has been widely received by lawmakers and as it is continually updated, it remains a valuable tool in advocacy conversations around policies that can help increase the supply of child care to better meet demand.
In Nebraska, the map dashboard has been used to initiate conversations among local lawmakers and urban planners in Lancaster, Douglas, and Sarpy counties. The findings of the dashboard have been shared by local news stations as well as in written mediums for urban planning professionals to reach new audiences that are integral to building better communities. First Five Nebraska hopes that this mapping data will lead to expanding transit routes and more funding for child care providers who offer transportation of their own.
We encourage child care advocates to share these map dashboards with a wide range of decision-makers, including state and local lawmakers, city and state administrators, urban planners, small business leaders, economic developers, employers, child care resource and referral agencies, families, school districts, and child care providers, and consider what mapping could bolster your advocacy work in 2024.
Have questions about our mapping work? Email us at research@usa.childcareaware.usa.org.